Introduction to Science 10: Safety, Measurement & the Scientific Method
Lab Safety
|
|
After watching the video, we will complete the Science Safety Worksheet together.
Check out the lab safety video from Zombie College. How are their rules different from ours? Same? There's an interactive game to play if you are interested. Next, work on the What Not to do comic with your table group. |
Why Science?
|
|
Why is science important? Create a list of at LEAST 30 words about how/when/where science is used in your everyday life. Next, we are going to create a word cloud WordItOut or Tagul to share our list in your ePortfolio on your Intro to Science page. Finally, you are to find at least 5 pictures representing something from your list and post them on your page.
|
The Scientific Method
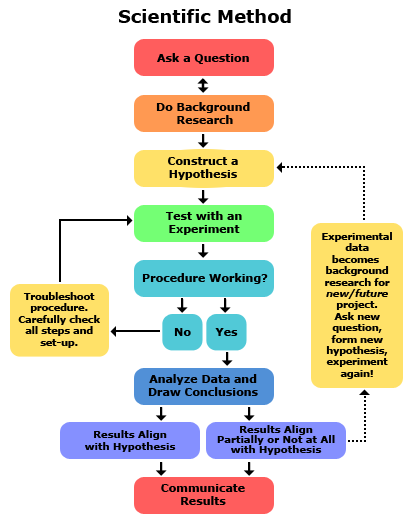
Discover the Scientific Method with this super fun webquest. It should take you about 45 minutes to work through the investigation and complete the answers. Record your answers on your worksheet. If the link doesn't work, just Google "Scientific Method Aspire".
Gum Lab Format
Date: Title Lab partners
Question:
Hypothesis:
Materials:
Procedure:
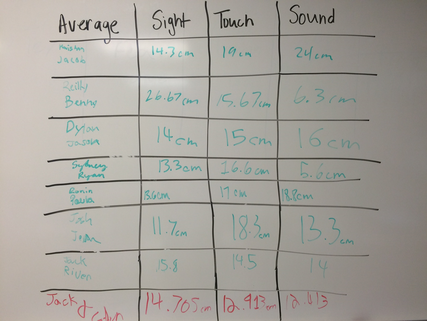
Results: (use a table to show your results)
Conclusion:
Futher Questions:
Include pictures of your lab!
Question:
Hypothesis:
Materials:
Procedure:
Results: (use a table to show your results)
Conclusion:
Futher Questions:
Include pictures of your lab!
Reflection Question #1:
|
This is going to be your first blog post on your reflections page. Give an example of how the Scientific Method can be applied to daily life. Explain how each step in the Scientific Method compares to your example. Think about how we discussed a broken bike tire as an example in class. Your post should be at least 100 words.
|
Graphing Data: Independent & Dependent Variables
Independent (manipulated) Variable
The independent (or manipulated / experimental) variable is the variable you purposely manipulate (change). Usually the x- axis on a graph.
Dependent (responding ) Variable
The dependent (responding) variable is the variable that is being observed, which changes in response to the independent variable. Usually the y- axis on a graph.
Controlled Variable
The variables that are not changed, that remain constant for both the experimental and control groups.
Remember, there are 3 main aspects of each graph that I will be looking for:
- Is the title descriptive and does it show a relationship between the independent and dependent variables?
- Are the axes labeled correctly? Did you give units when appropriate? Is the independent variable on the x-axis and the dependent variable on the y-axis?
- Is the number scale correct? Are the numbers in even increments on both the horizontal and vertical axis? Are they all attached to a line? Did you start at zero?
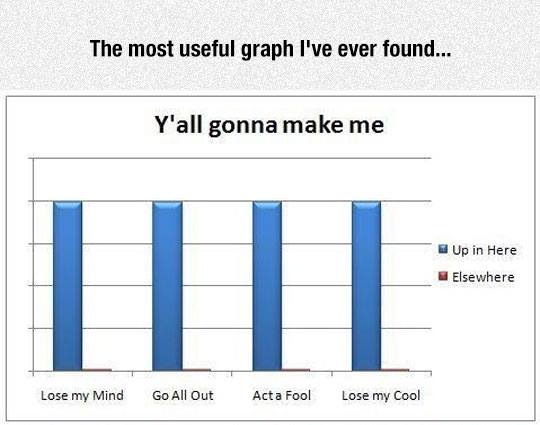
Here's a graph Ms. Burden thinks is hilarious!
Final activity: Myth Busters!
|
|
Your task: Watch the video in class (Sept 21) and record how the Myth Busters are following the Scientific Method for each of the three myths. You'll want to watch carefully so you don't miss anything!
|
